1 / 22
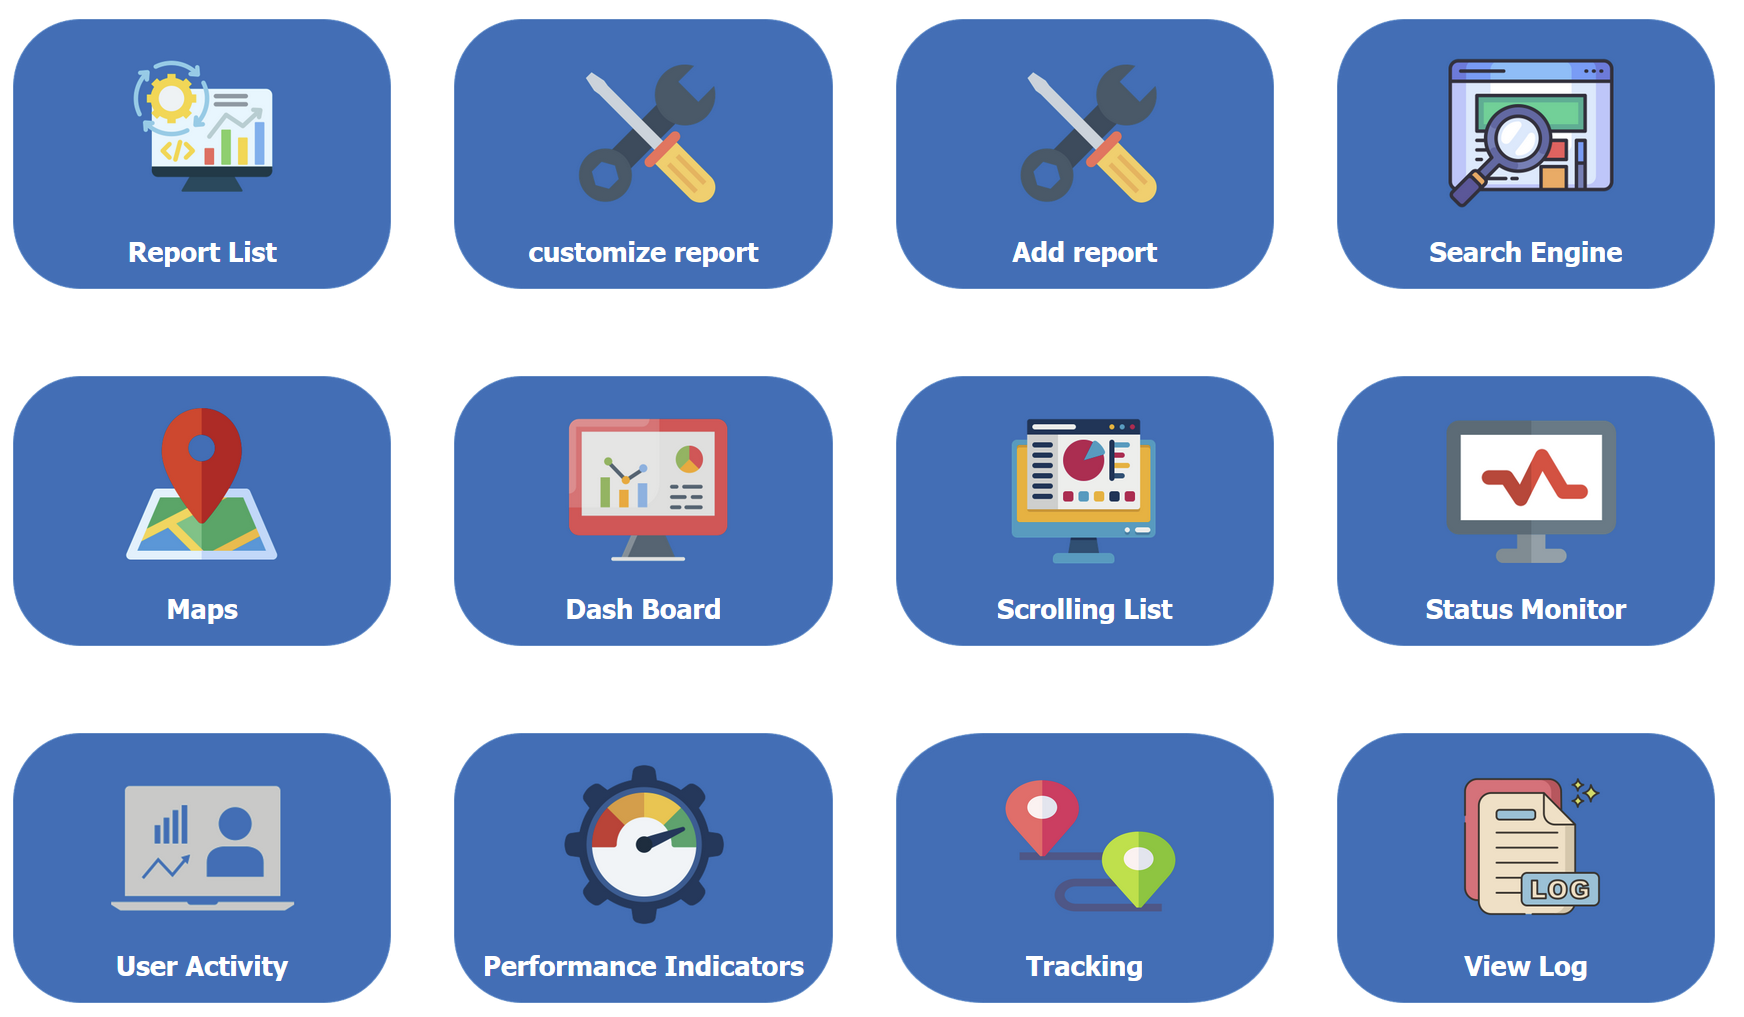
1: The reports have a set of options which covers different types of output such as visual,graphical,maps or simple list of records
2 / 22
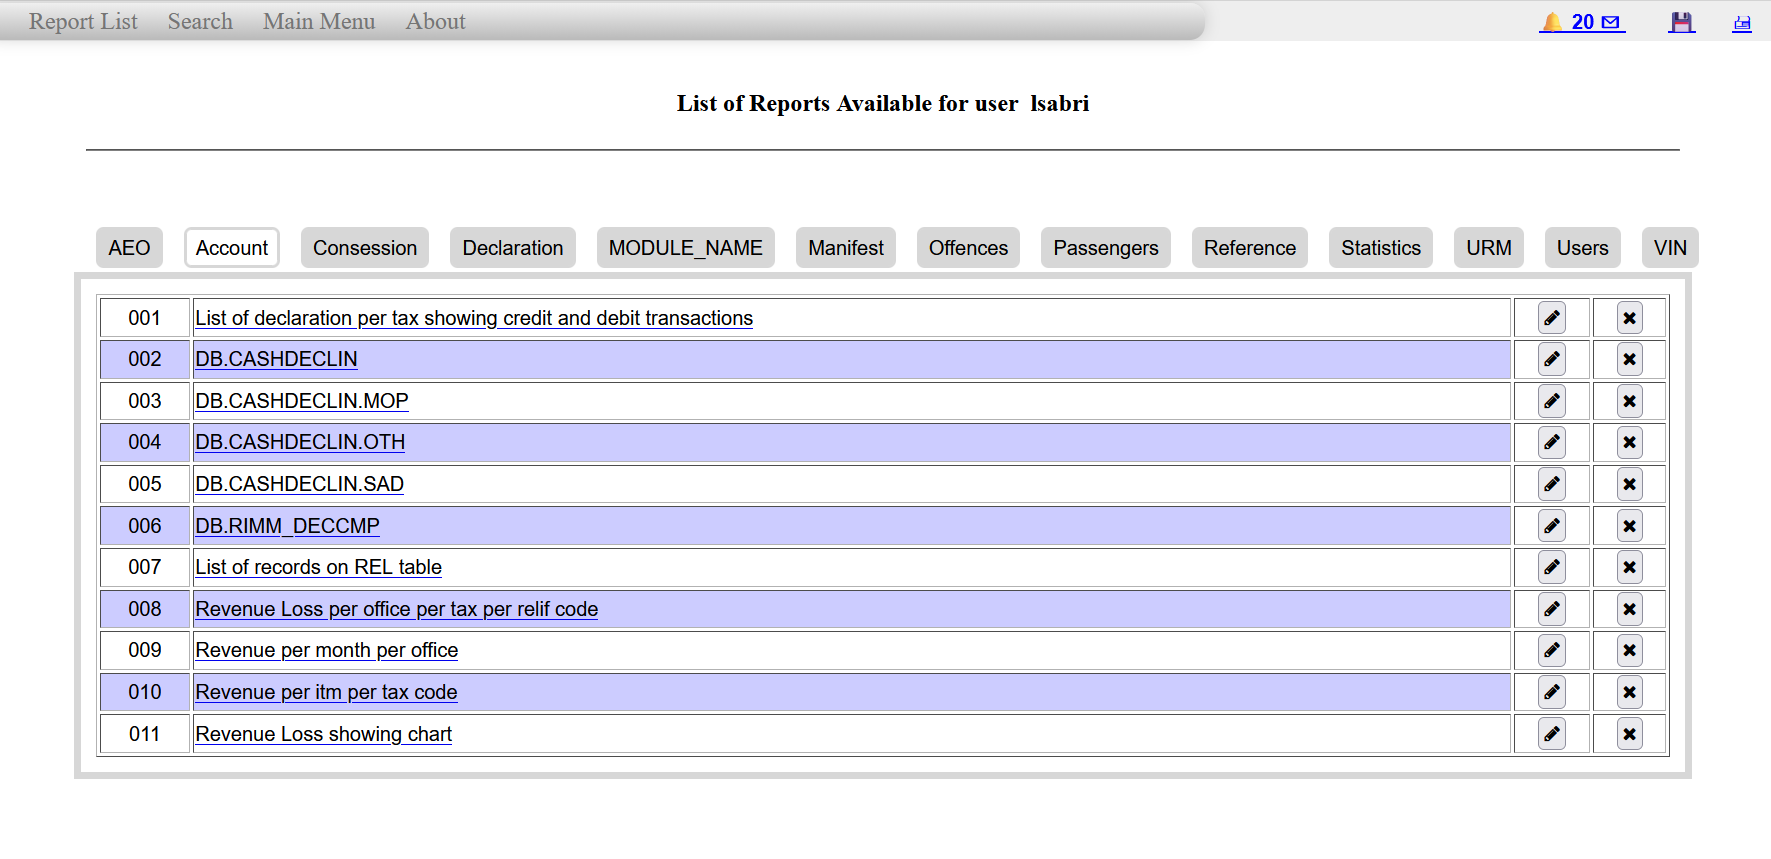
2: List of predefined reports shown on the main menu for reports
3 / 22
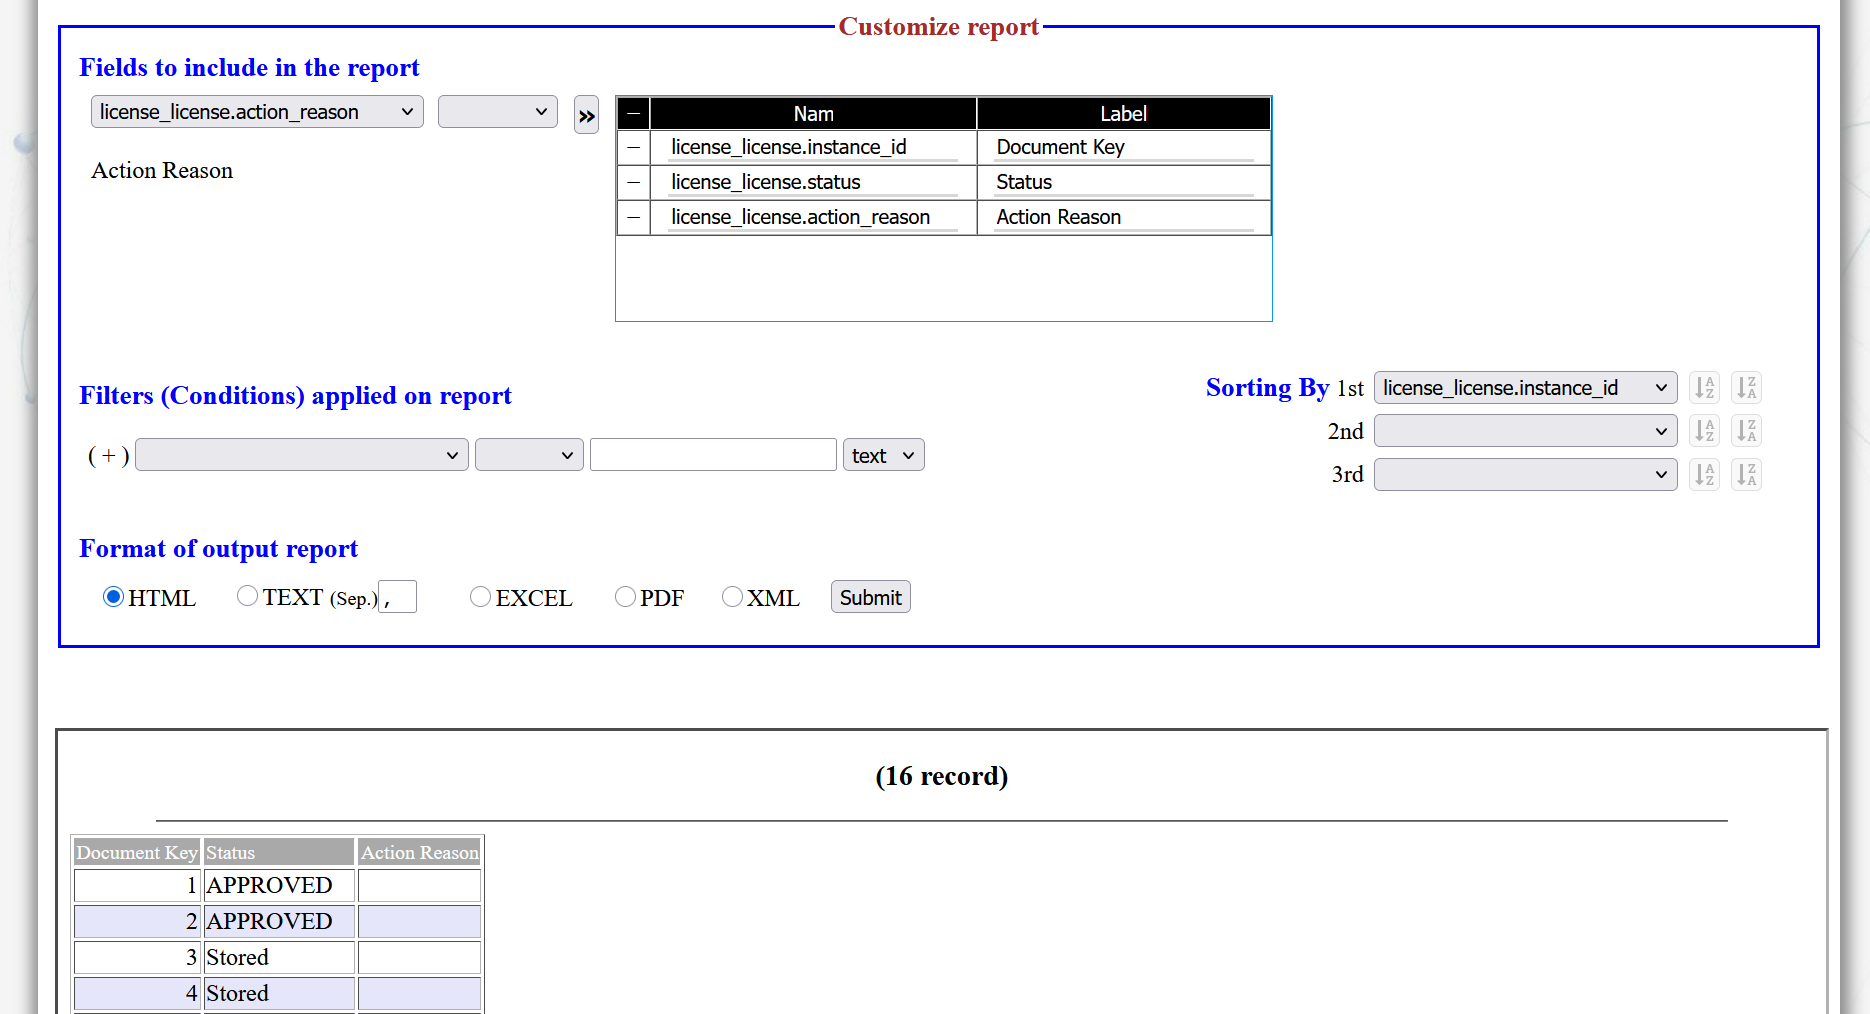
3: New reports can be customized and executed directly and generate reports in different format.
4 / 22
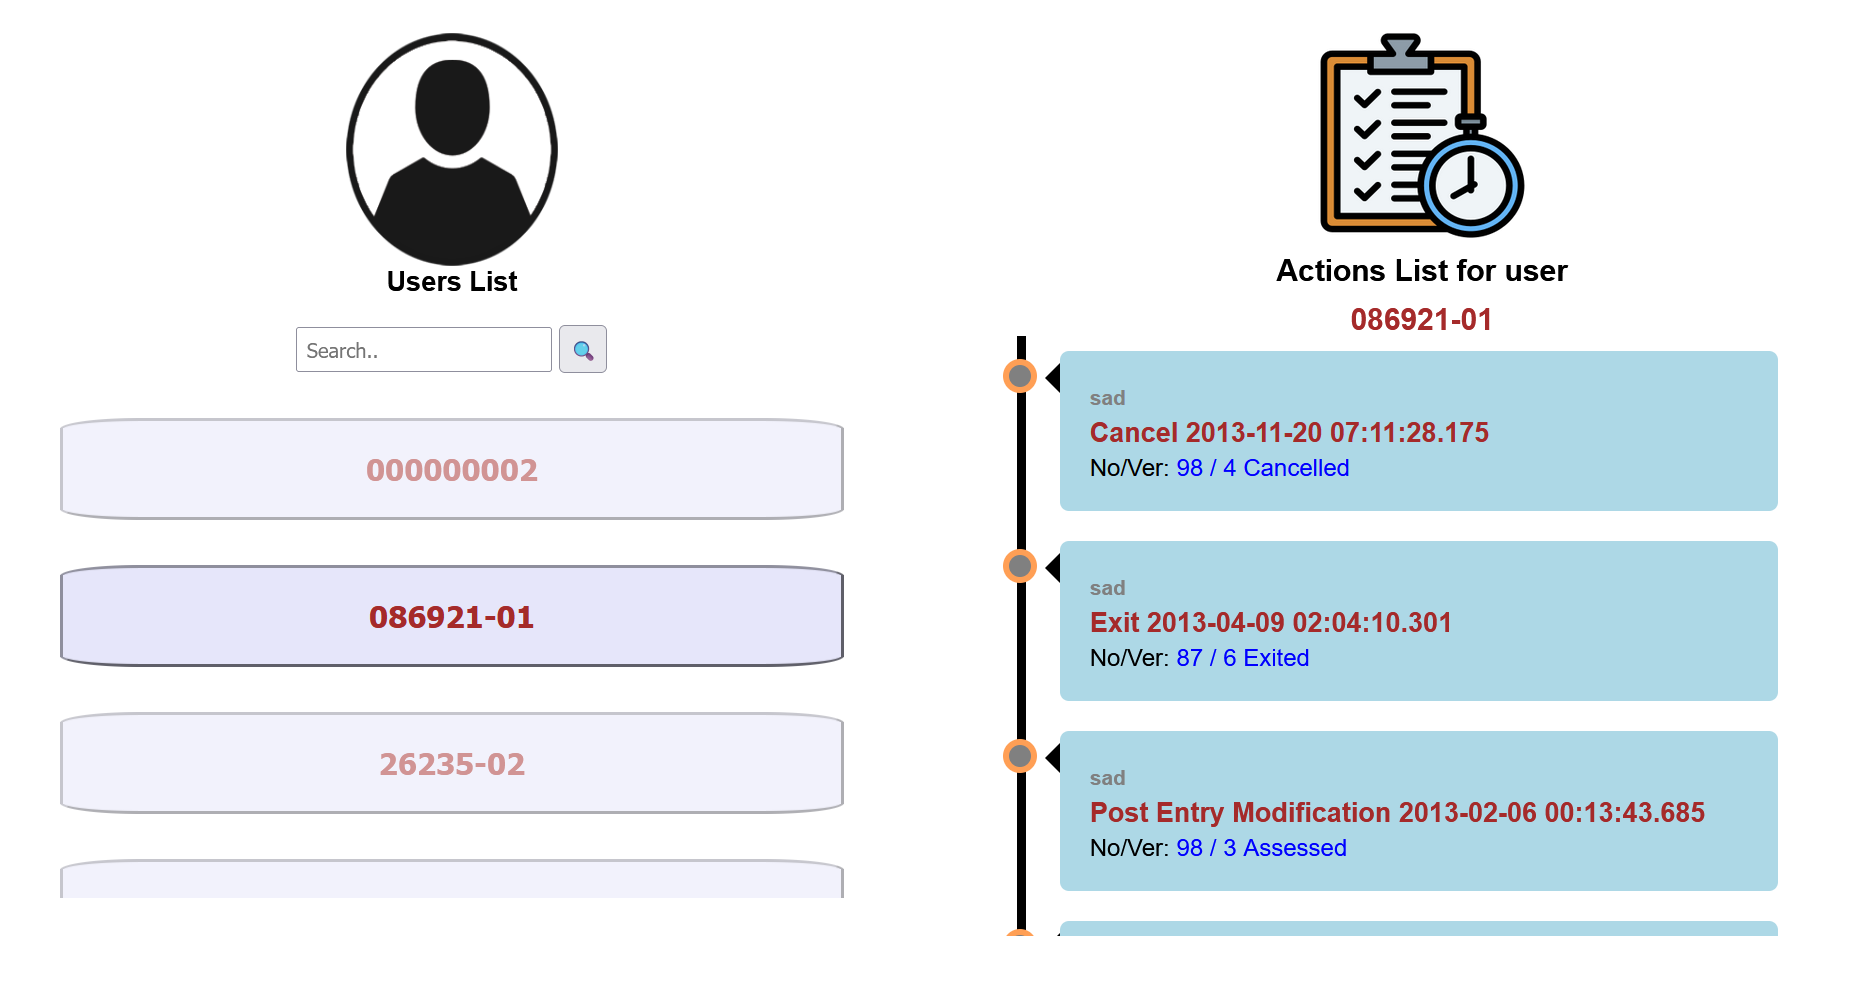
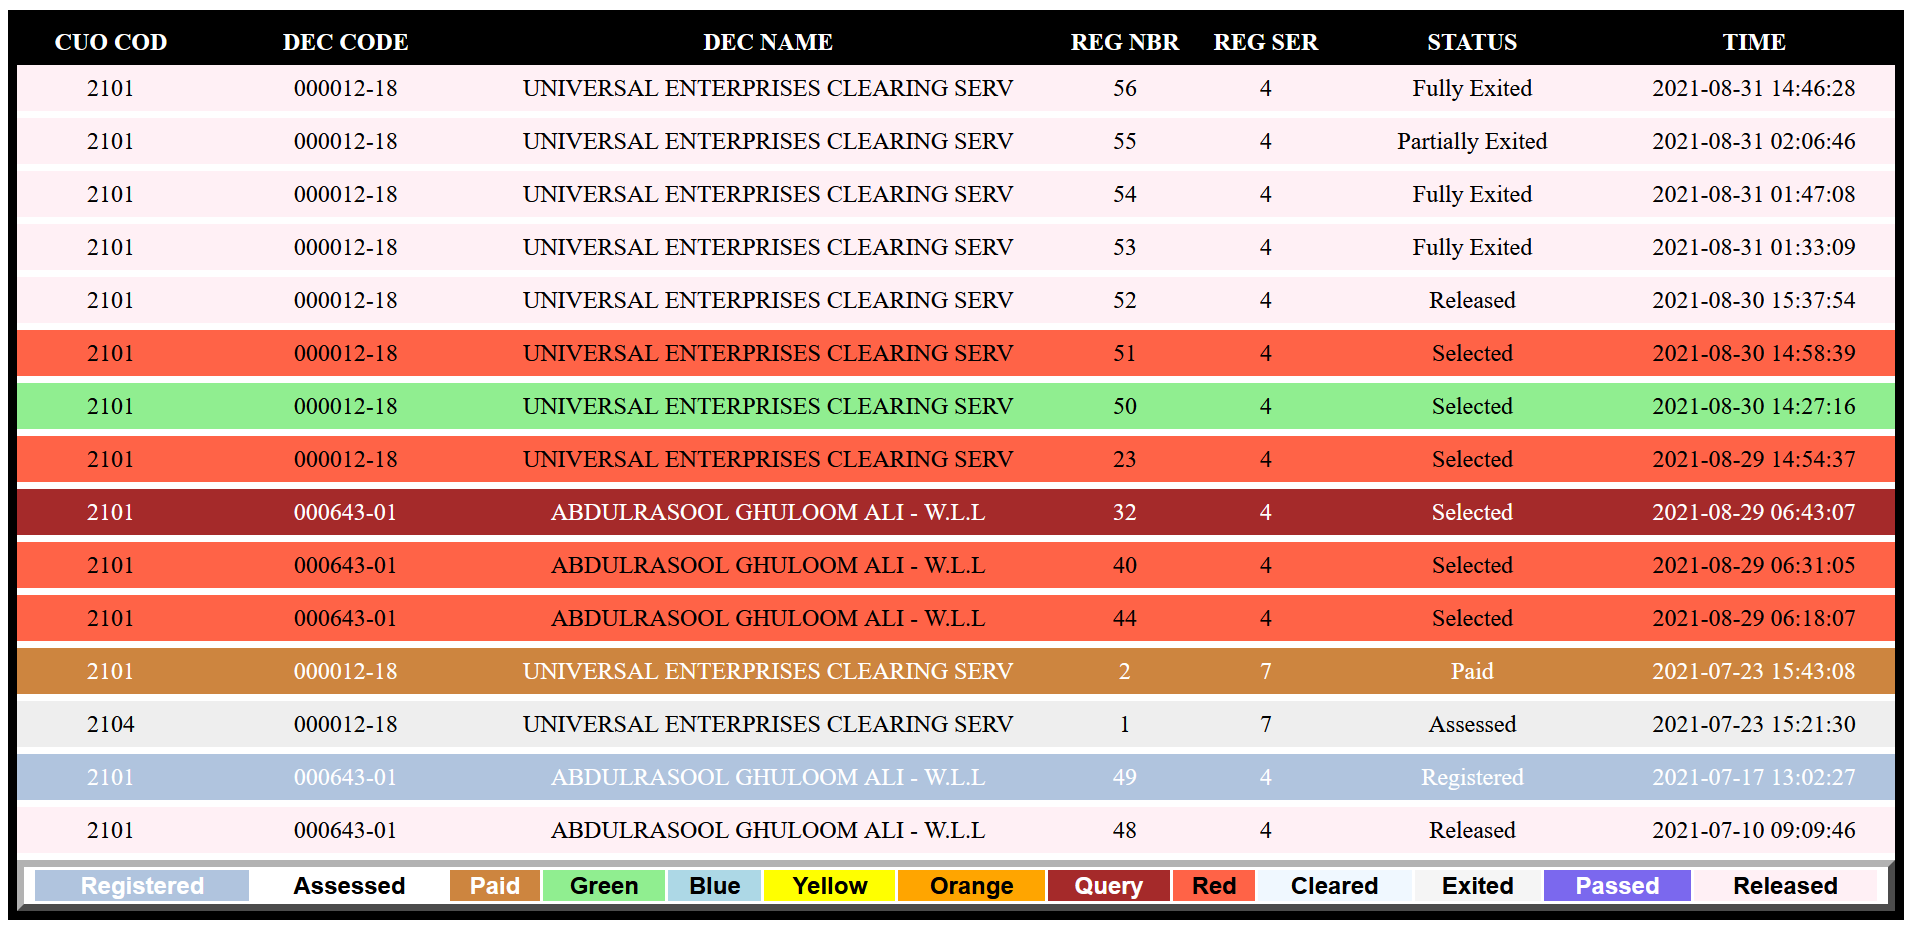
4: The report module provide tool to show user activities
5 / 22
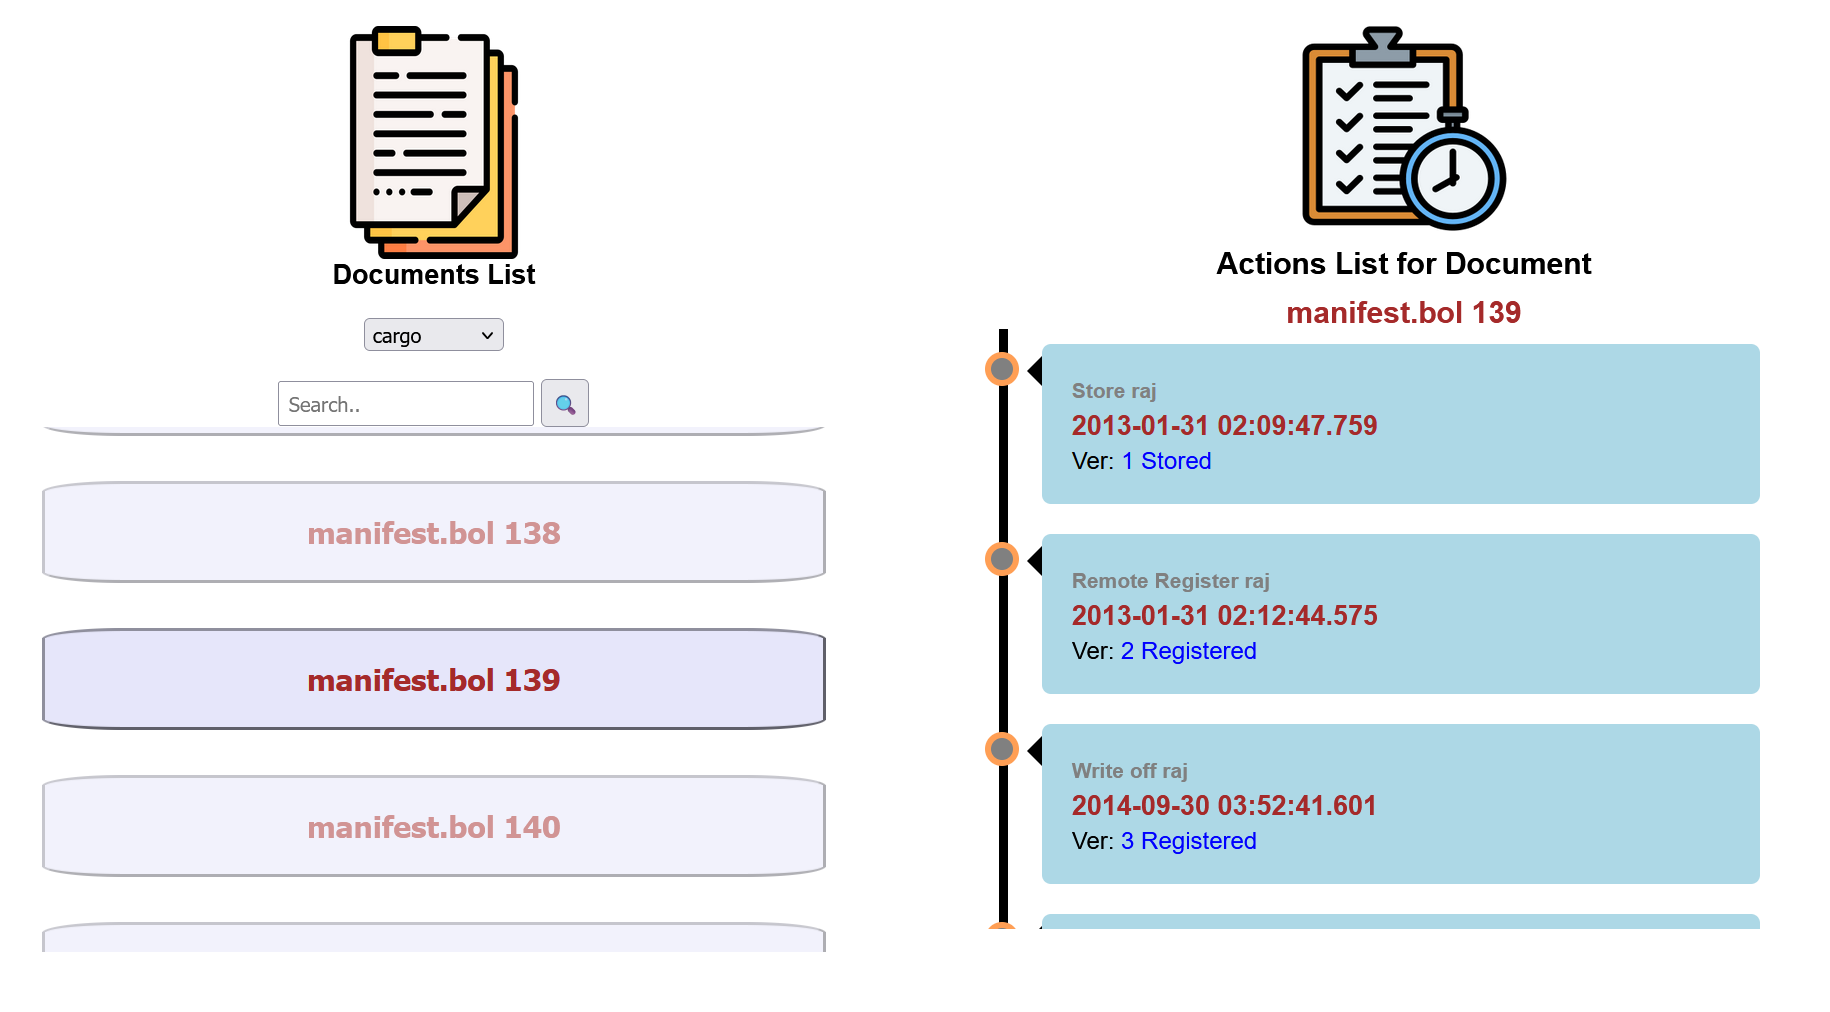
5: The report module provide utility to monitor status of documents
6 / 22
6: Scrolling list of processed documents is provided instantly.
7 / 22
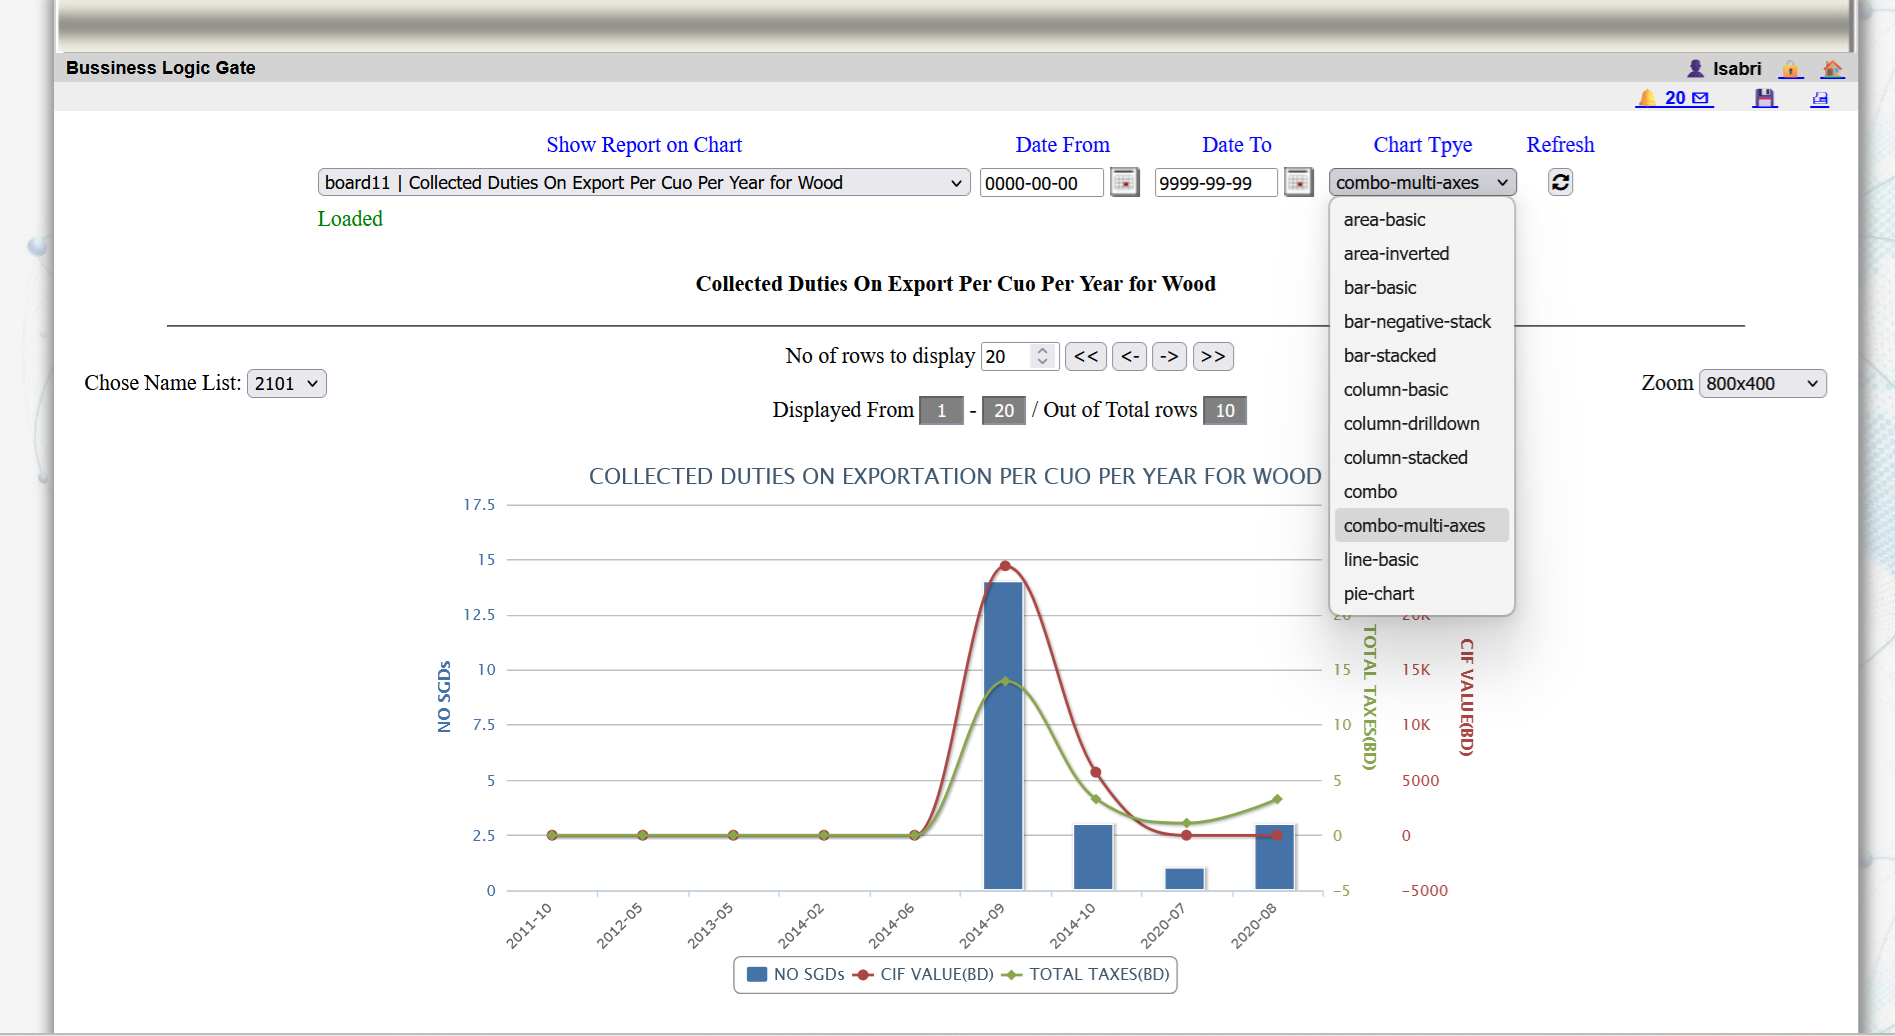
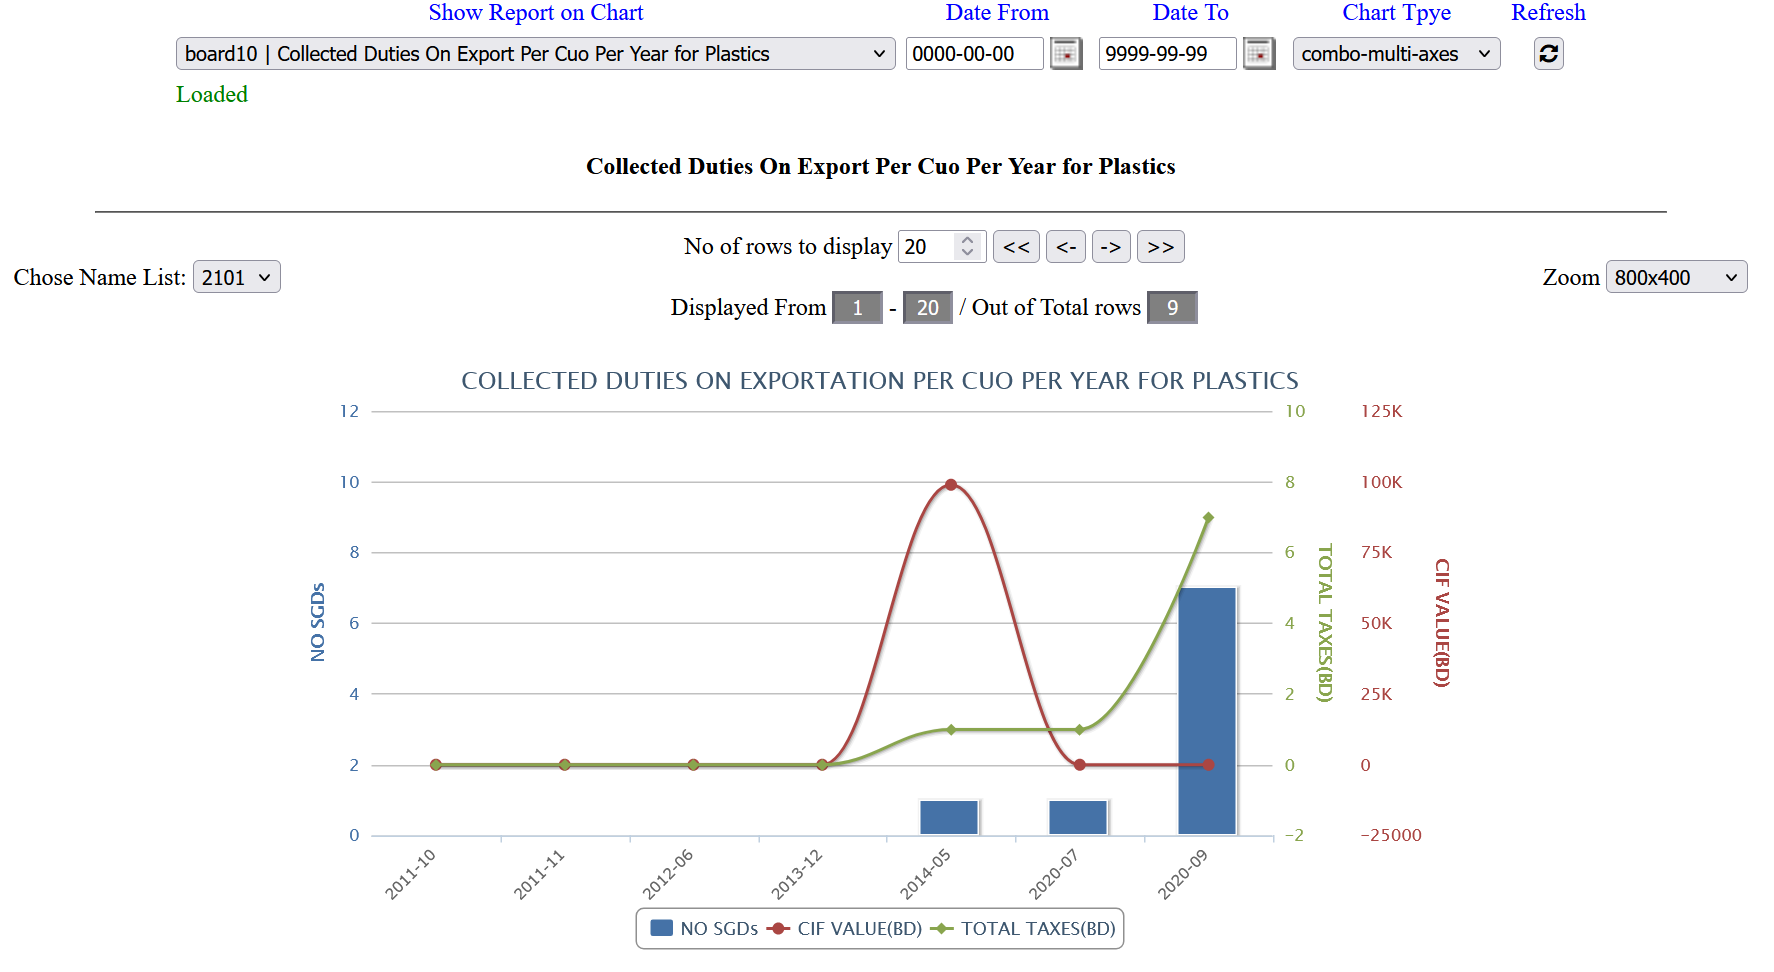
7: The system provide different forms of dashboards with different options
8 / 22
8: The dashboard provide different types of charts.
9 / 22
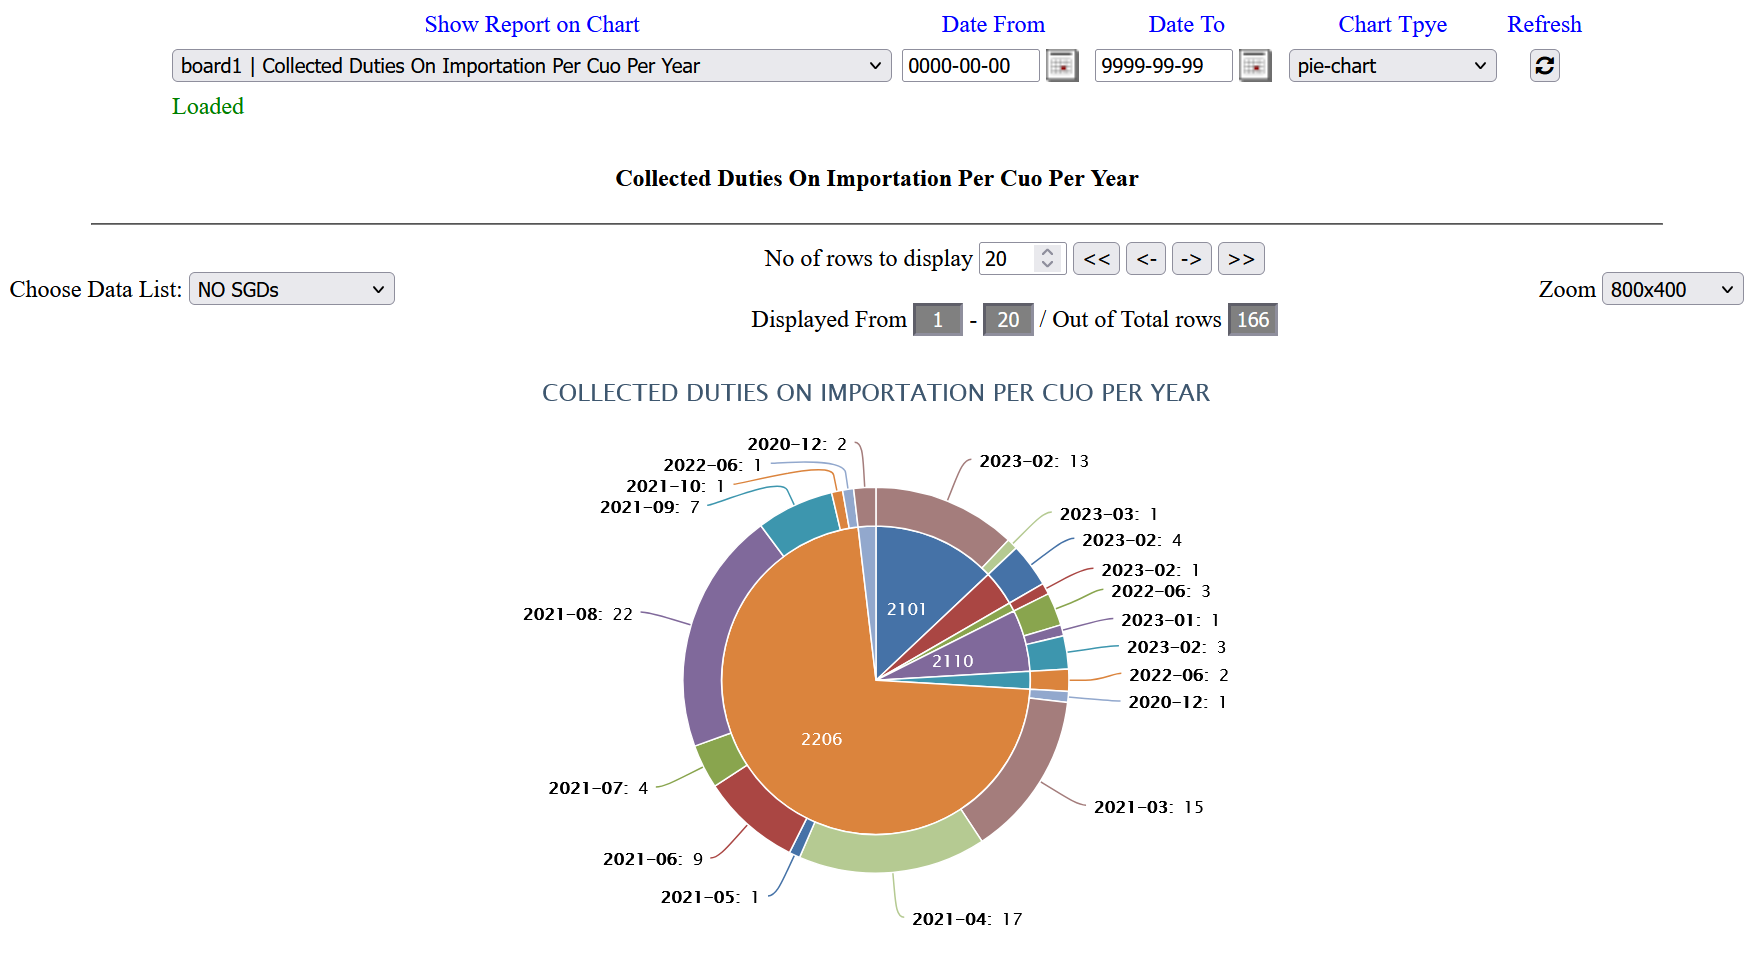
9: The following chart shows a pie-chart.
10 / 22
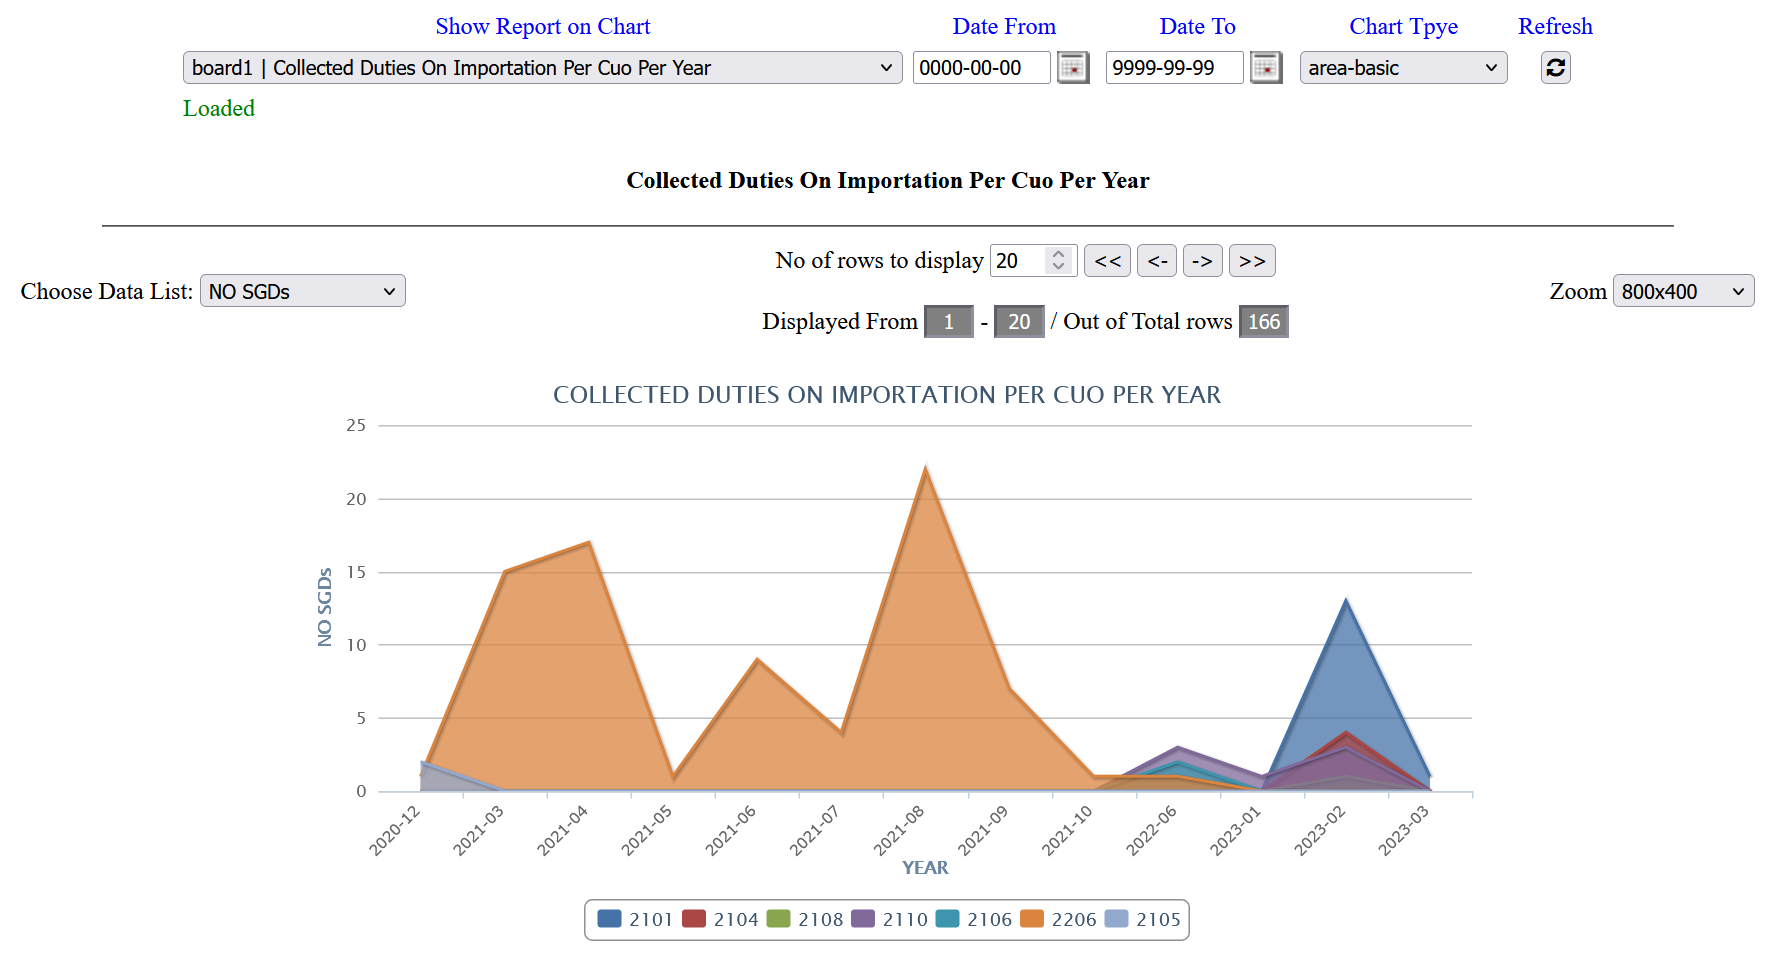
10: The following chart shows data as area-basic chart
11 / 22
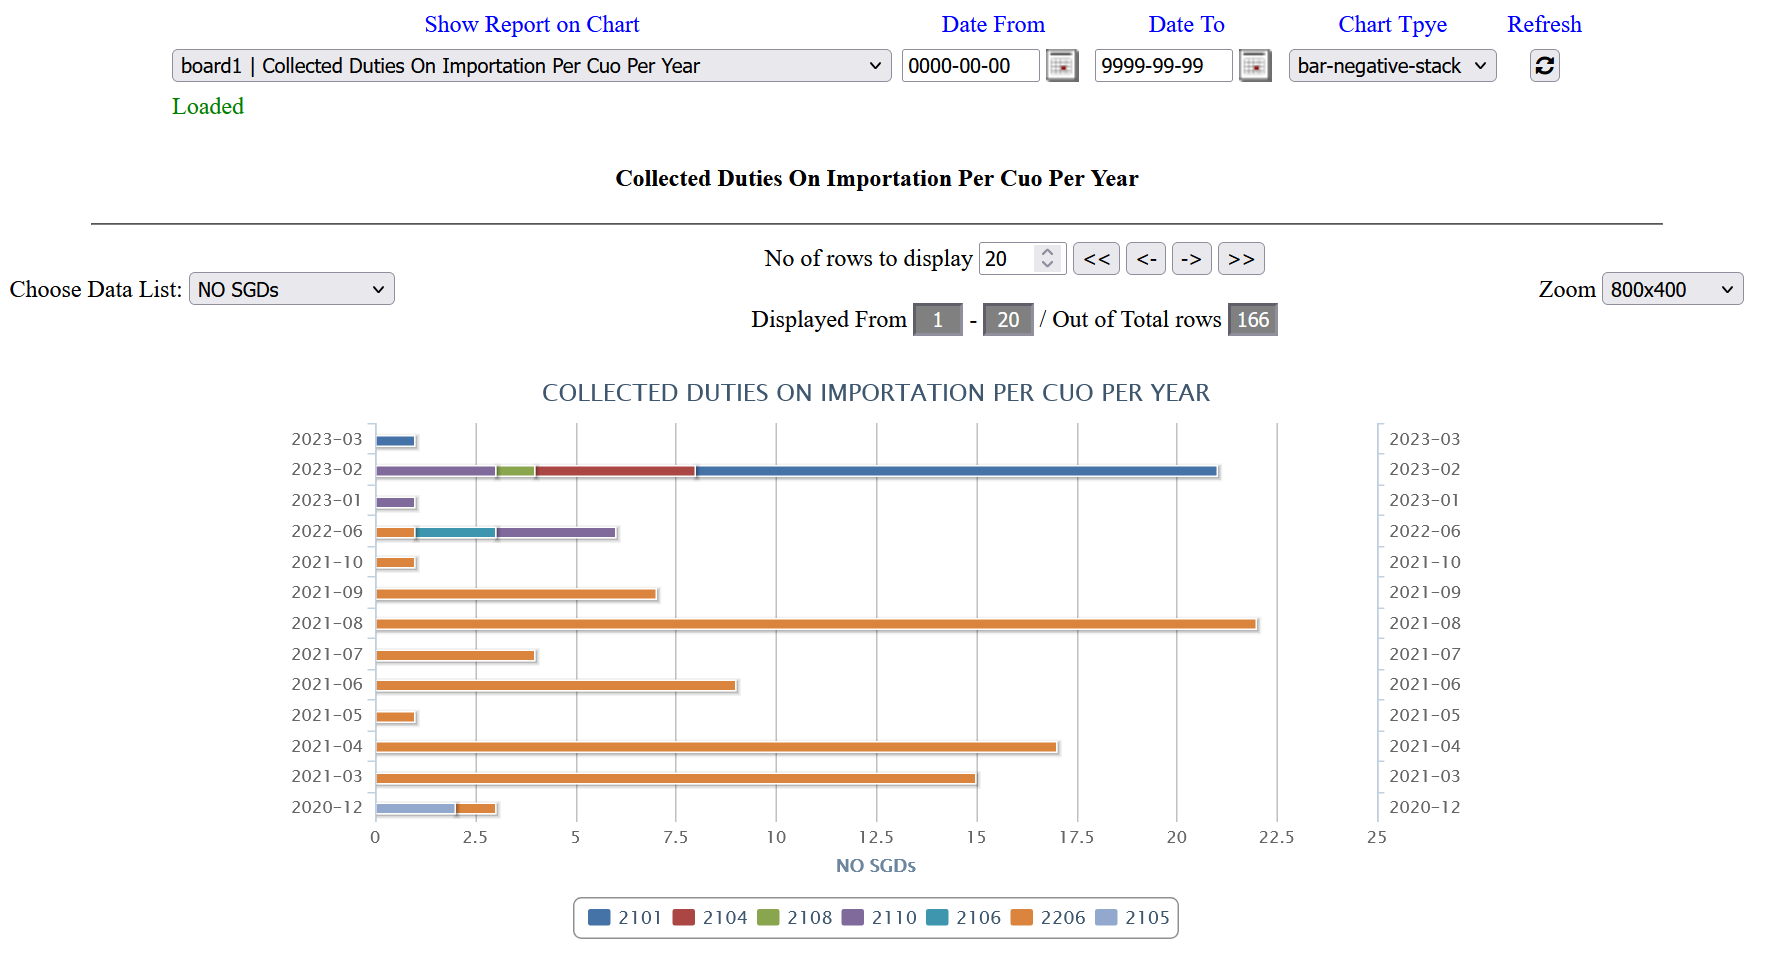
11: The following shows data as bar-negative stack.
12 / 22
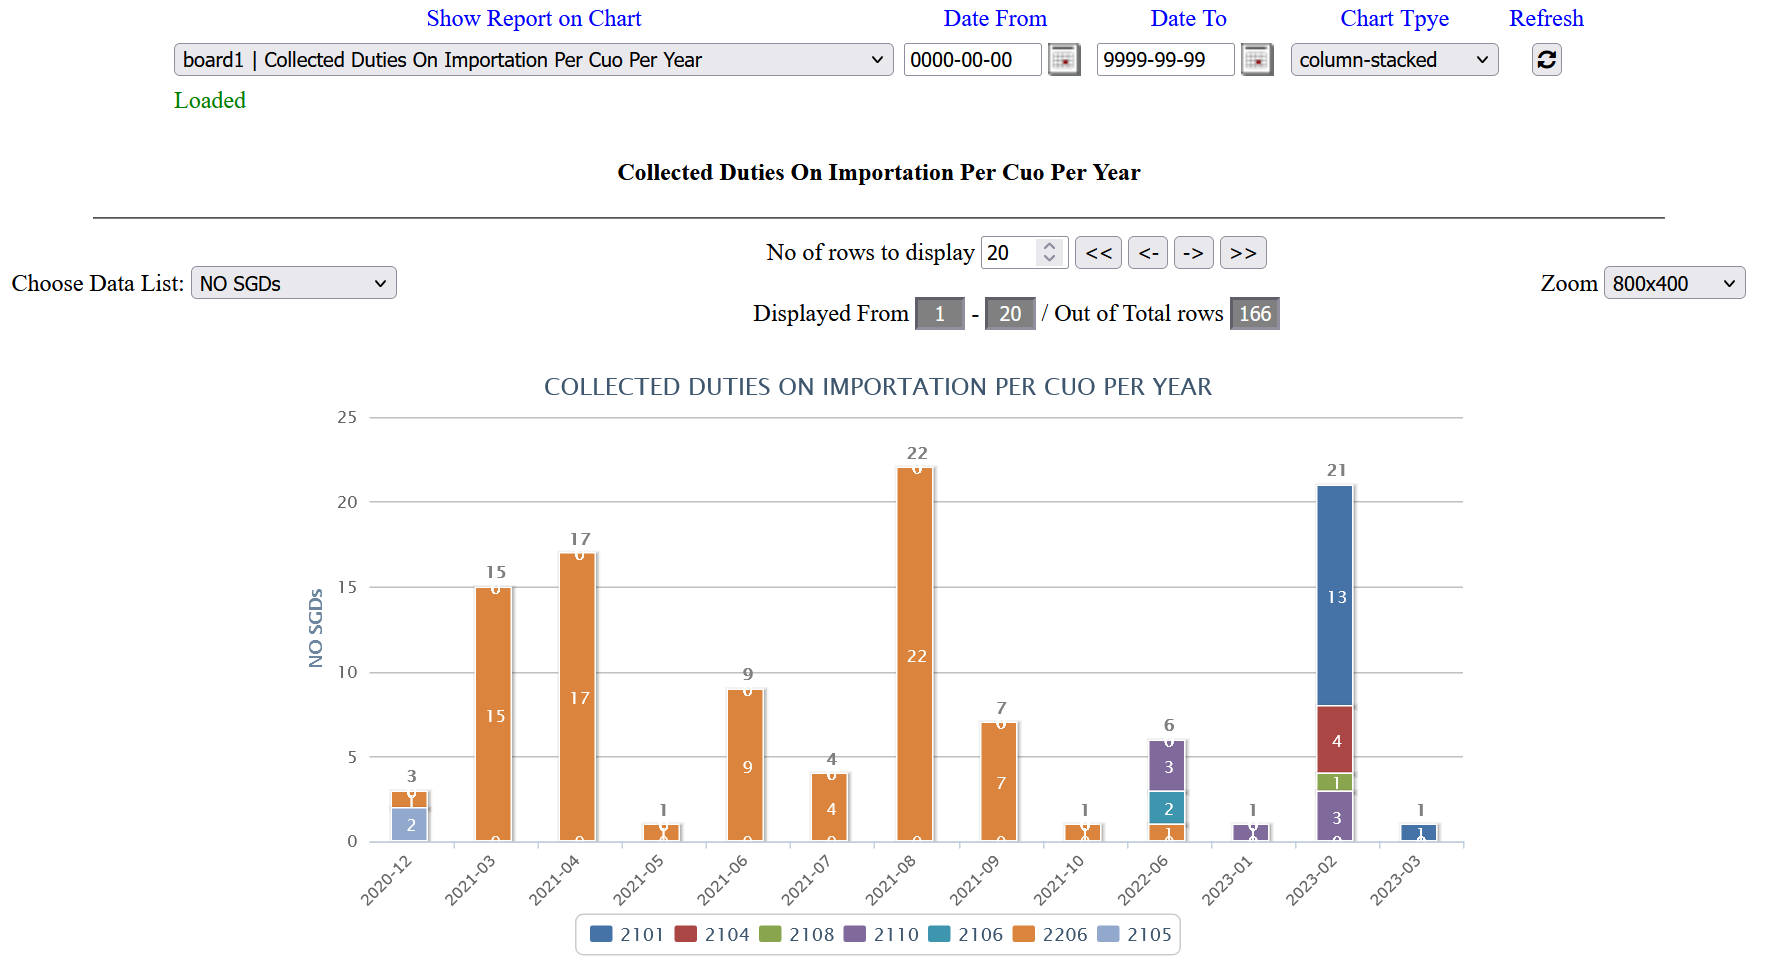
12: The following chart type as column stack.
13 / 22
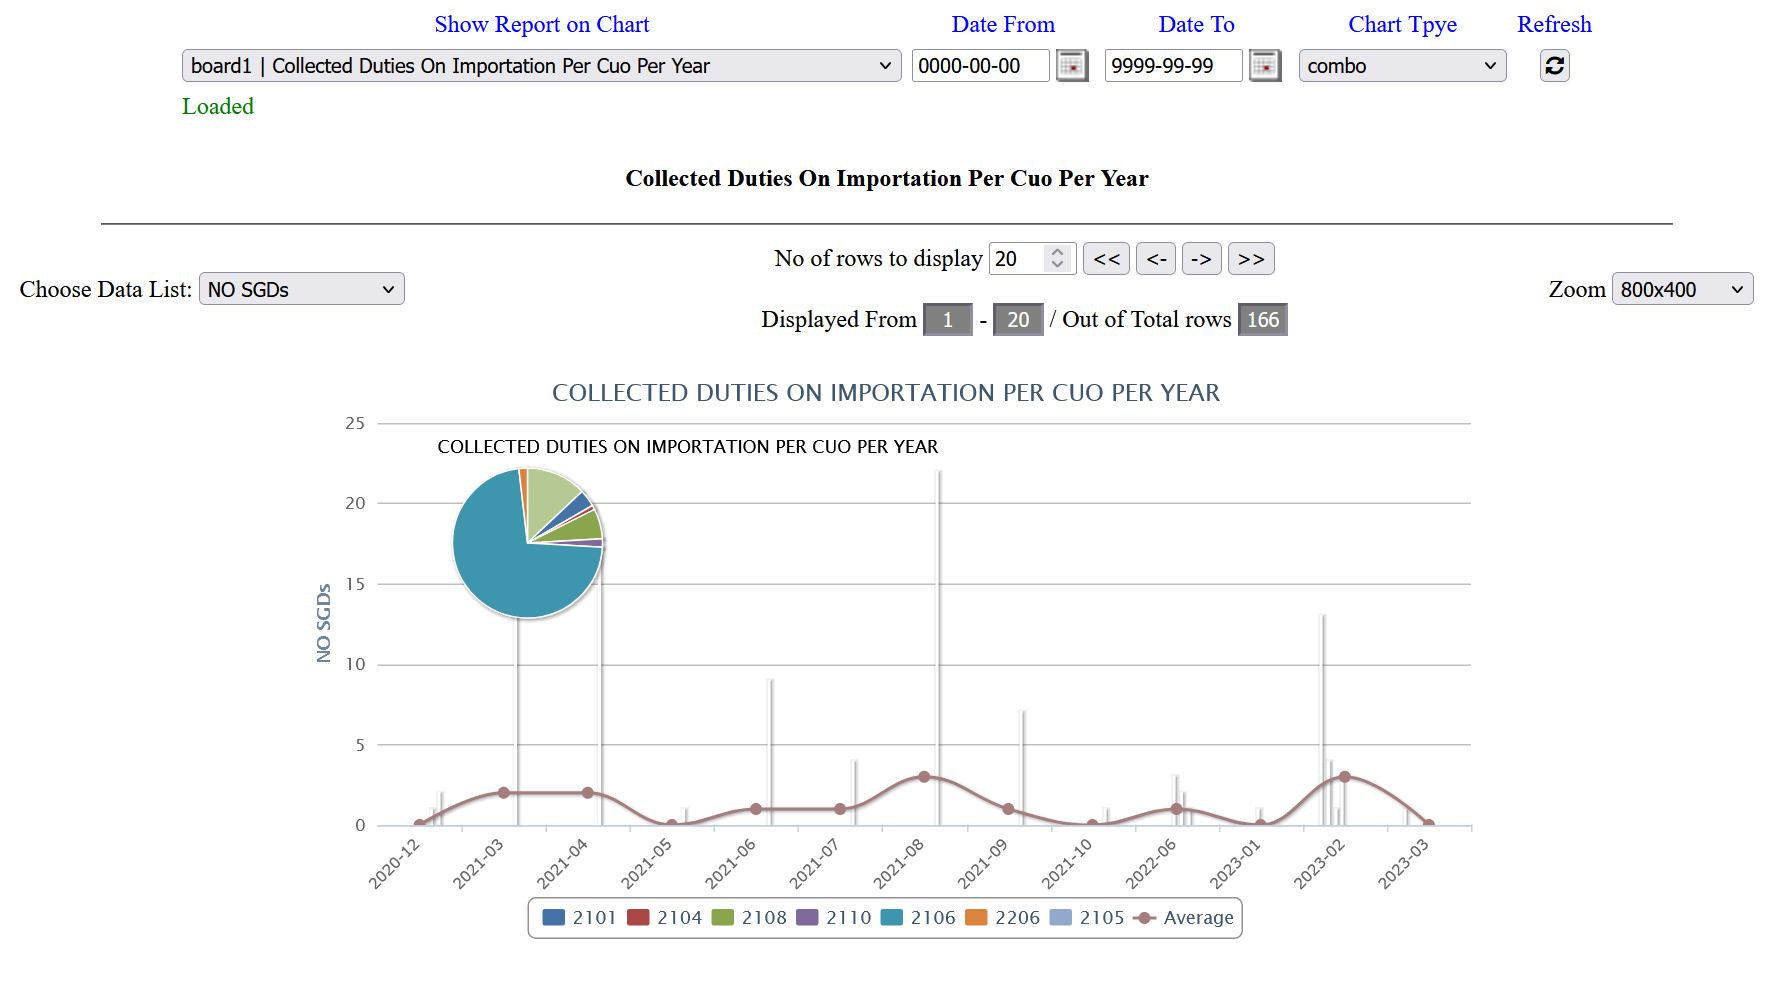
13: The tool can provide mixed combo graphs at the same chart.
14 / 22
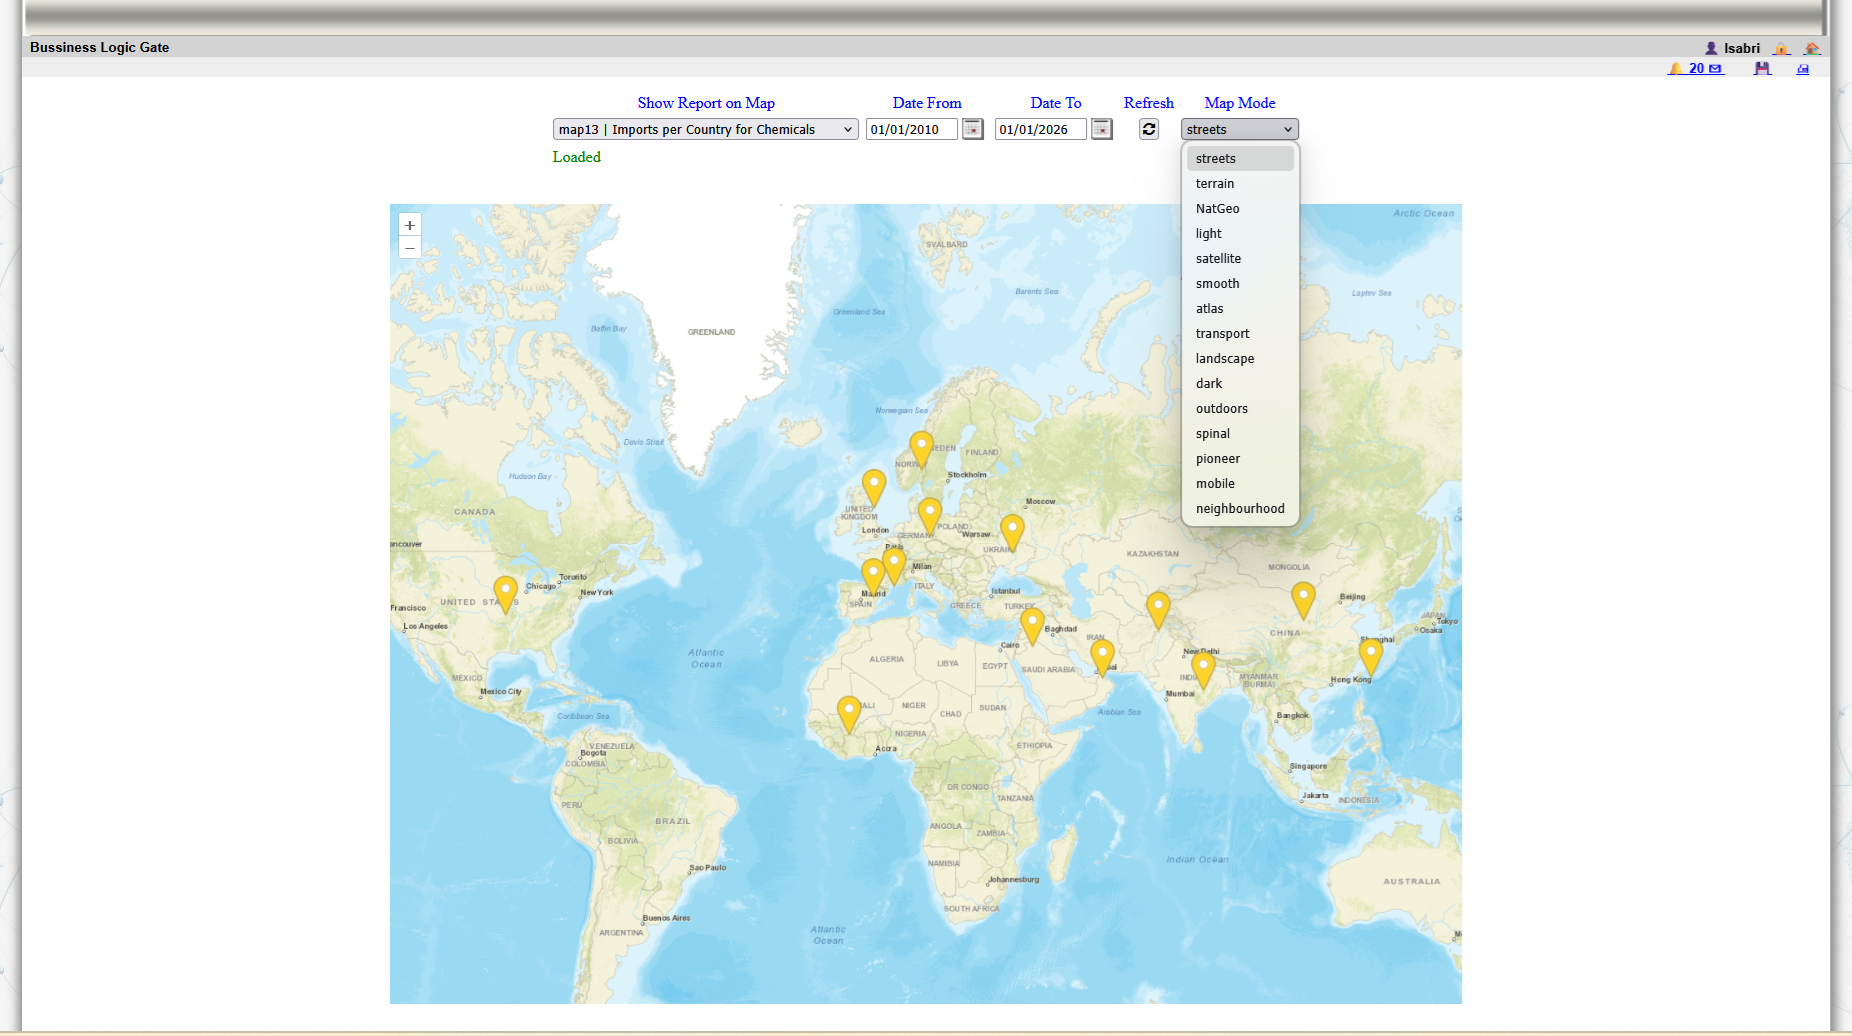
14: Maps are tools provided by the system to show data as visual data with different types of modes.
15 / 22
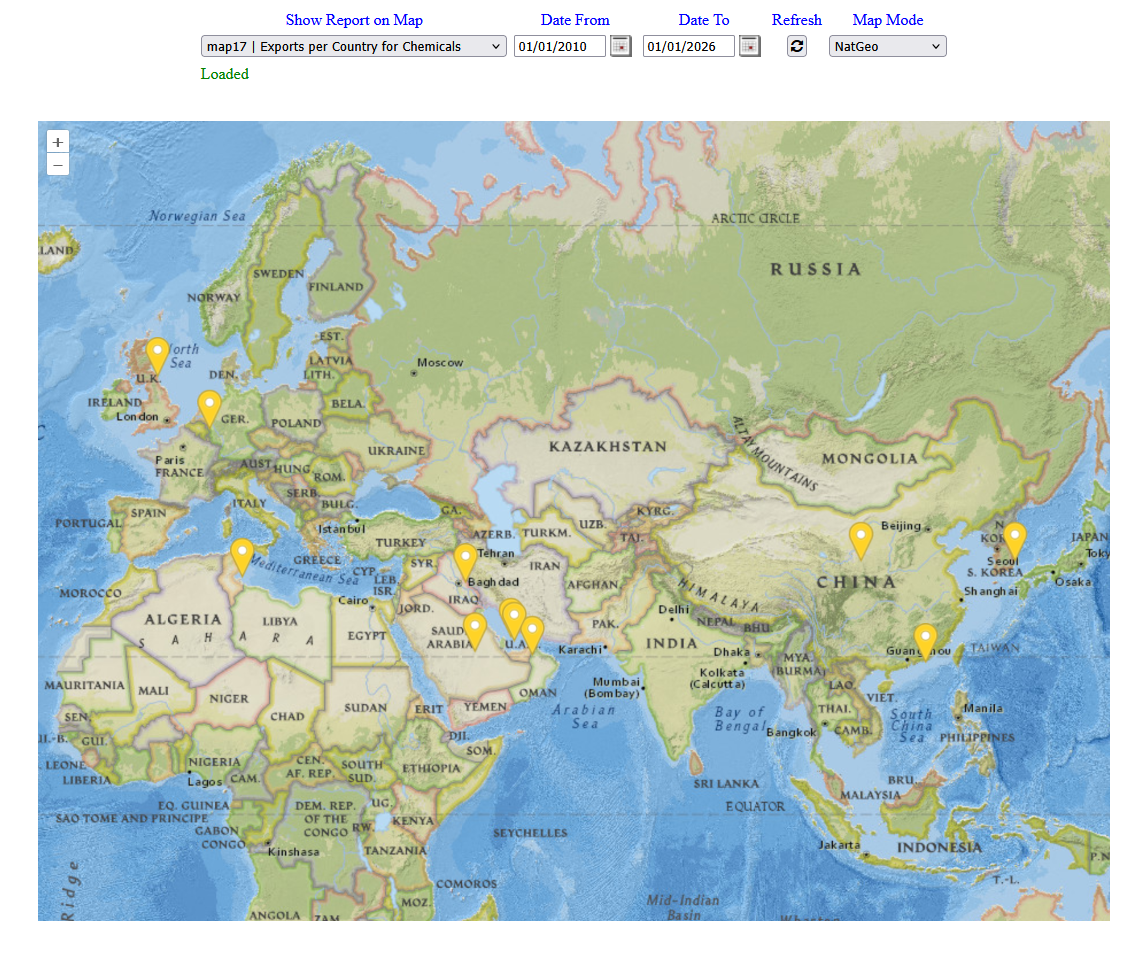
15: Different modes for maps are provided such as Natgeo mode
16 / 22
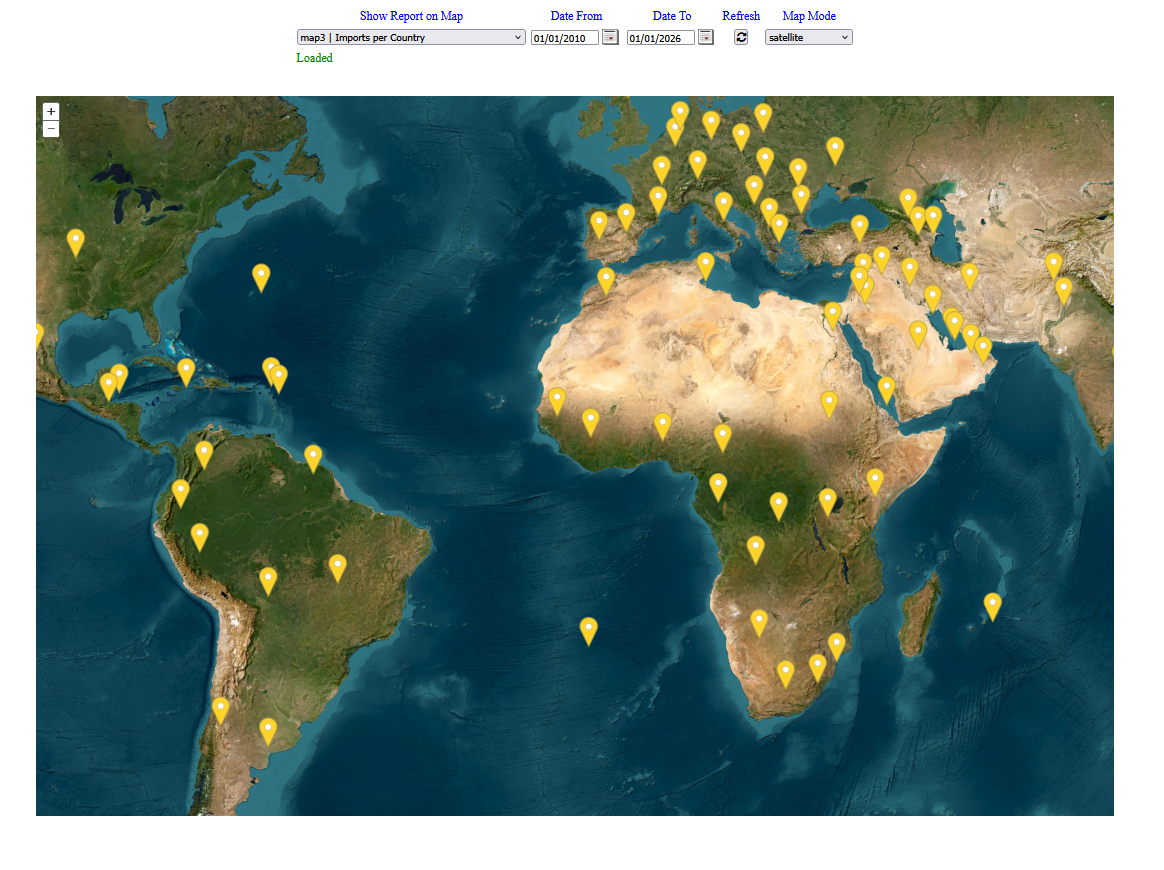
16: Satellite mode map.
17 / 22
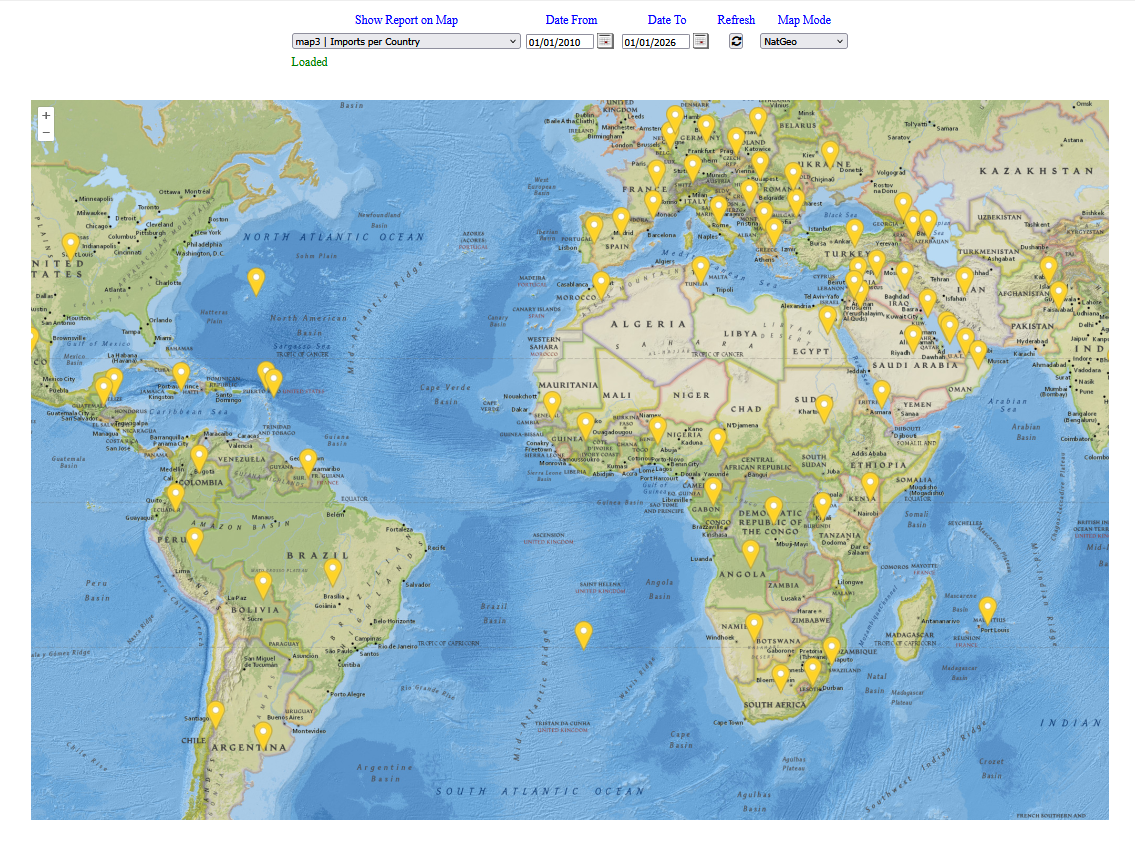
17: The map shows the spread of data for specific module.
18 / 22
18: The report module provide a way to track the movement of parcels for couriers modules
19 / 22
19: Tracking map offers different types of modes to visual the data.
20 / 22
20: Ligth map mode
21 / 22
21: Natgeo map mode for tracking information
22 / 22
22: Tracking information for certain path of courier parcel is reflected on the map.